
📄 Total Policies: 2M
⚕️ Critical Care Add-ons: ~200K (10%)
💡 Super Top-up Awareness: ~400K (20%)
❌ Claim Rejection Rate: ~10% (Lower in Bangalore due to better healthcare infrastructure)
Insight: Awareness of Super Top-up Insurance is lower than Critical Care Add-ons, highlighting a need for more customer education.


💡 Super Top-up Awareness: ~400K (20%) – Lower than Critical Care Add-ons
❌ Claim Rejection Rate: ~10% (India Average) – Slightly lower in Bangalore due to better healthcare infrastructure
Health Insurance in Bangalore
🎯 Target Audience
Health insurance policyholders
Busy professionals needing quick and easy claim filing
🛠️ Research Methods:
Surveys 📊:
Gather quantitative data on insurance type, cost, and awareness of critical care add-ons & super top-up insurance.
Interviews 🎙️:
Understand experiences, pain points, and knowledge of insurance terms through one-on-one discussions.
User Testing 🧑💻:
Observe users filing claims online or via phone to identify usability issues and process gaps.
Objective: Enhance user experience by addressing pain points and improving awareness of health insurance options.


UX Research Plan for Health Insurance Policyholders in Bangalore
Deliverables
📄 Report: Summarizes the findings of the research.


📊 Presentation: Highlights the research findings and provides recommendations for improving the health insurance claims process.
🎨 Prototype: A new user interface design for the health insurance claims process.
Calculation approach
📝 Total Claims Filed
Count the total health insurance claims submitted within a year.✅ Approved Claims
Identify the number of claims successfully approved.➖ Rejected Claims
Subtract the approved claims from the total claims to find the number of rejected claims.🔢 Rejection Rate Formula
Rejection Rate=(Rejected ClaimsTotal Claims Filed)×100\text{Rejection Rate} = \left( \frac{\text{Rejected Claims}}{\text{Total Claims Filed}} \right) \times 100
📌 Final Percentage
The result represents the percentage of health insurance claims rejected.
📌 Assumptions for Average Rejection Rate Calculation
The following assumptions were made to calculate the Average Rejection Rate of health insurance claims:
📝 Total Health Insurance Claims Filed (Annually): 100,000
✅ Approved Claims: 90,000
❌ Rejected Claims: 10,000
🔍 Result
Based on these assumptions, the Average Rejection Rate is 10%.
🔗 Useful Links for the Indian Insurance Industry
Stay updated with the latest regulations and industry insights:
🏢 Insurance Regulatory and Development Authority of India (IRDAI): irdai.gov.in
🤝 Indian Insurance Industry Association (IIA): iiaindia.org


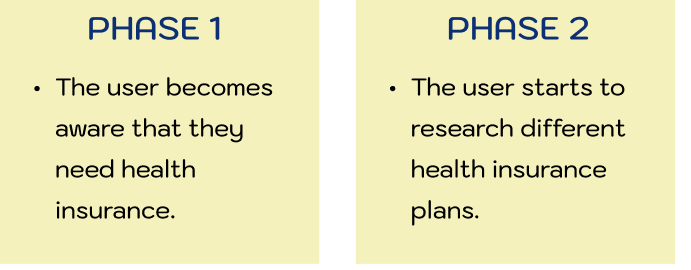
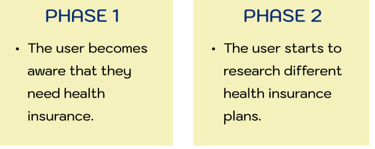
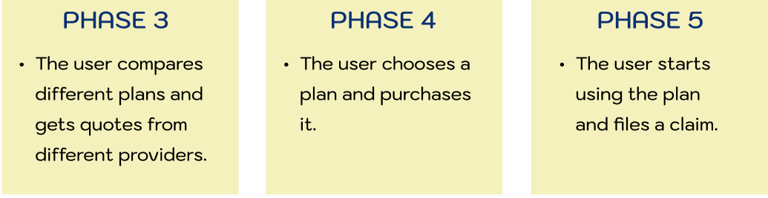
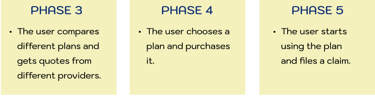
JOURNEY MAPPING
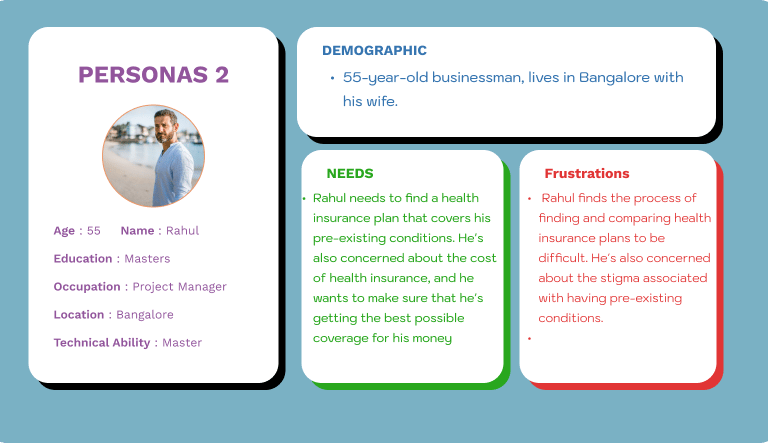
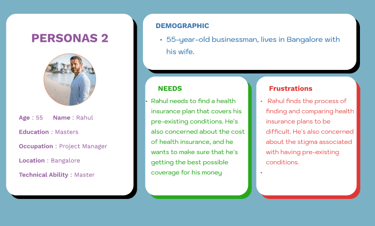
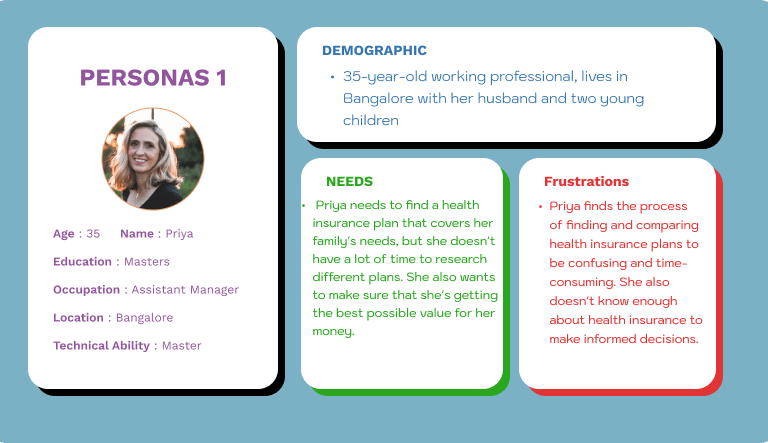
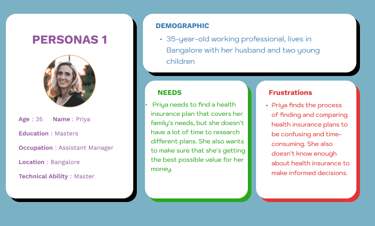
USER PERASONAS
📅 Time-Consuming – Finding and purchasing a plan requires hours of research and comparing fine print.
🌀 Confusing – The market is cluttered with hundreds of plans, making it difficult to choose the right one.
📞 Poor Support – Many providers offer slow, unhelpful customer service, leaving residents frustrated.


Pain Points in Health Insurance
⚡ Increase Efficiency – Simplify the process with comparison tools and clear summaries to help residents quickly find the right plan.
🔍 Enhance Transparency – Provide detailed, easy-to-understand information on plan options, pricing, and terms.
📞 Improve Customer Support – Offer responsive, respectful, and accessible assistance to ensure residents get help when needed.
Opportunities to Improve the Buying Experience


Story boarding - some possible service opportunities


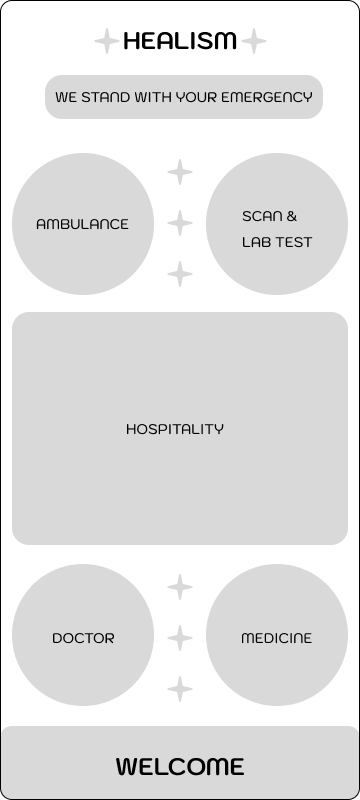
Easy-to-Use Interface
🚑 Simple & Fast – Quick ambulance selection with minimal steps.
⚡ Emergency-Friendly – Intuitive design for stress-free use.


Real-Time LocationTracking
📍 Live Tracking – Detects user location instantly.
🚑 Faster Dispatch – Sends the nearest ambulance.
⚡ Quick Response – Reduces wait time for emergencies.


Nearest Hospital Functionality
🏥 Find In-Network Hospitals – Shows hospitals covered by insurance.
📍 Location-Based Search – Identifies the closest options.
📅 Filtered by Needs – Matches hospitals to appointment type.
Clear Instructions & Service
📖 Easy-to-Follow Steps – Simple guidance on using the CT scan feature.
🌍 Multi-Language Support – Instructions available in multiple languages.
🔍 Advanced Filters – Search providers by scan type, specialty, or criteria.


Smart Hospital Search
📍 Location-Based Search – Find nearby hospitals with available beds.
🏥 Detailed Hospital Profiles – View location, hours, and insurance coverage.
Online Video Chat Consulting
📹 Real-Time Doctor Consultations – Connect with doctors instantly.
🎯 Easy & Accessible – Simple interface for hassle-free use.
🔊 High-Quality Video & Audio – Clear communication for better care
Clear & Transparent Coverage Information
🗣 Simple Language – Easy-to-understand explanations in multiple languages.
📖 Detailed Information – Clear breakdown of covered services, care levels, and costs.
🔍 Full Transparency – No hidden details; clear on what’s covered and what’s not.
📂 Easy Access – Coverage details should be easy to find, not buried in menus.
🔄 Regular Updates – Ensures users get the latest coverage information.
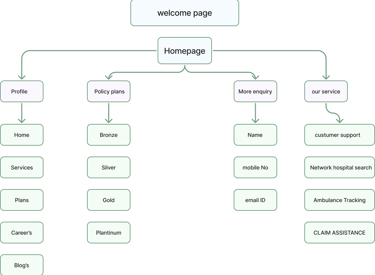
Information architecture (IA) is a critical component of user experience (UX) design, as it focuses on organizing and structuring information to facilitate user understanding and efficient navigation within a digital product or platform. When conducting a UX case study, creating a thoughtful IA is crucial for delivering a seamless and intuitive user experience.
INFORMATION ARCHITECTURE
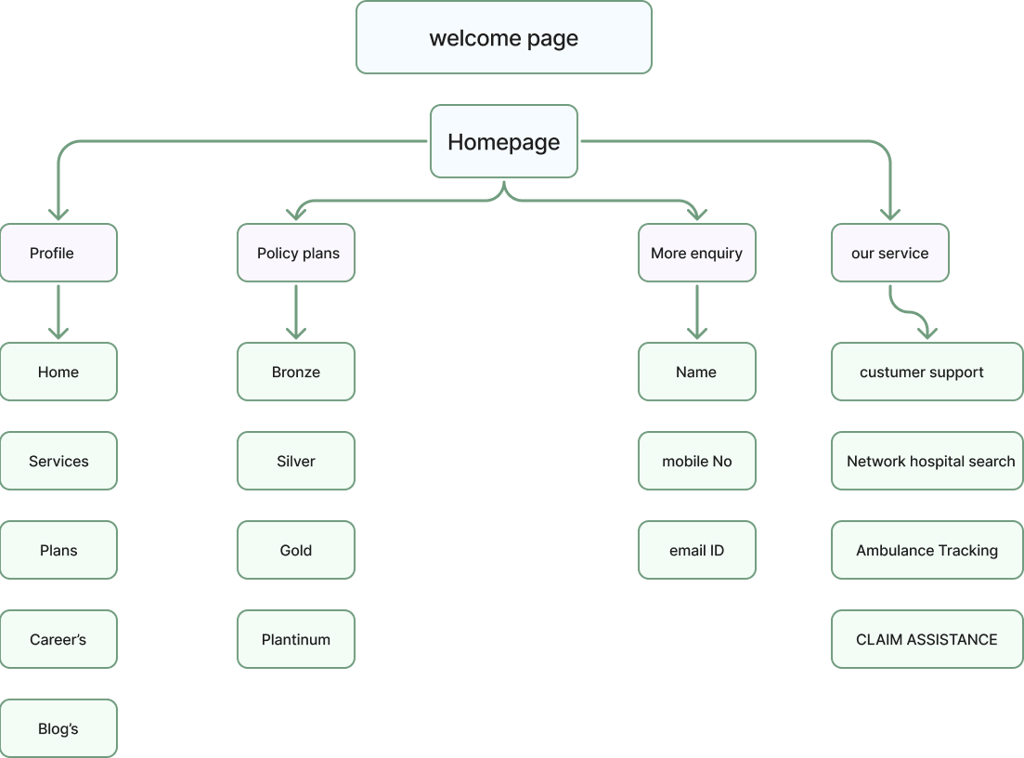
Digital Wireframe for a health insurance app. The app will allow users to manage their health insurance policies, file claims, and access health information.
User and Audience: The target users for this app are health insurance policyholders. The app will be used by people of all ages and with varying levels of technical expertise.
Roles and Responsibilities: The project team consists of a UX designer, a UI designer, and a developer. The UX designer will be responsible for creating the wireframes, the UI designer will be responsible for designing the app's user interface, and the developer will be responsible for coding the app.
DIGITAL WIREFRAME

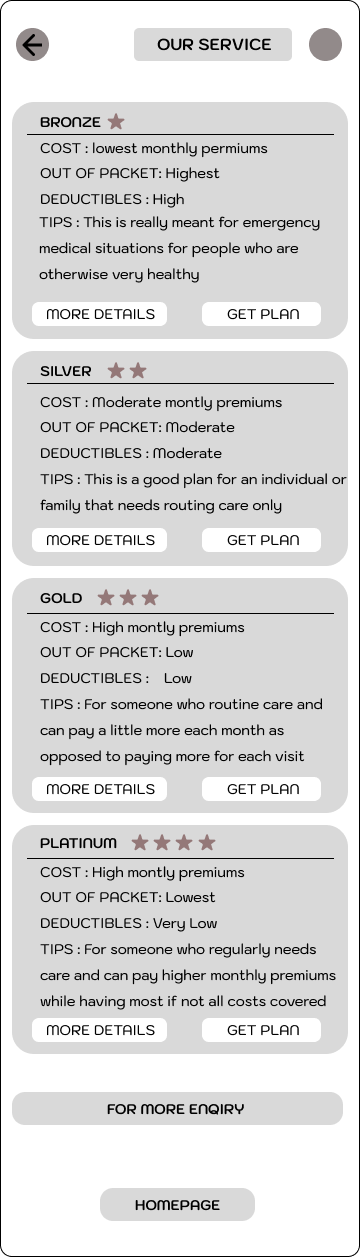
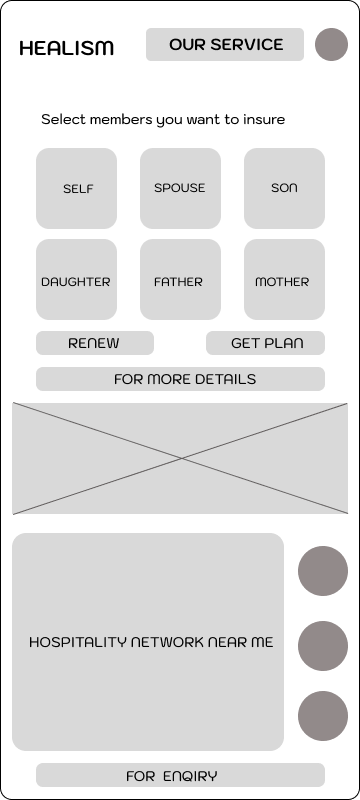
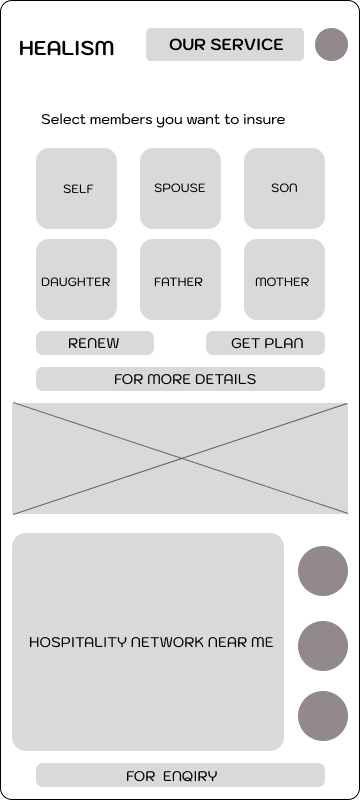

Health Insurance App Wireframe
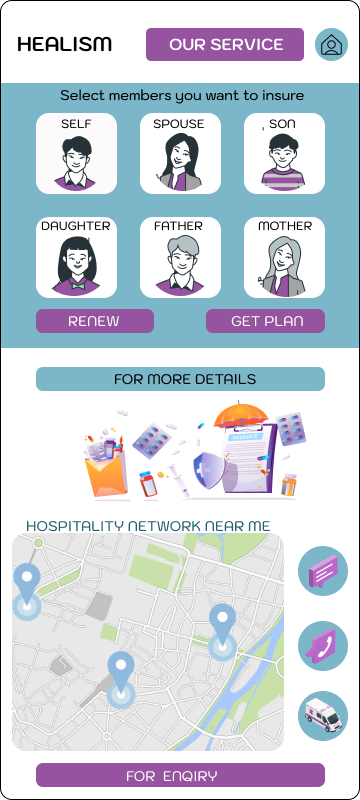
🏠 Home – Dashboard, search, notifications.
📑 Policy – View details, renew/upgrade.
📄 Claims – Upload docs, track status.
🏥 Health Info – Find providers, coverage details.
📞 Support – Chat, call, FAQs..
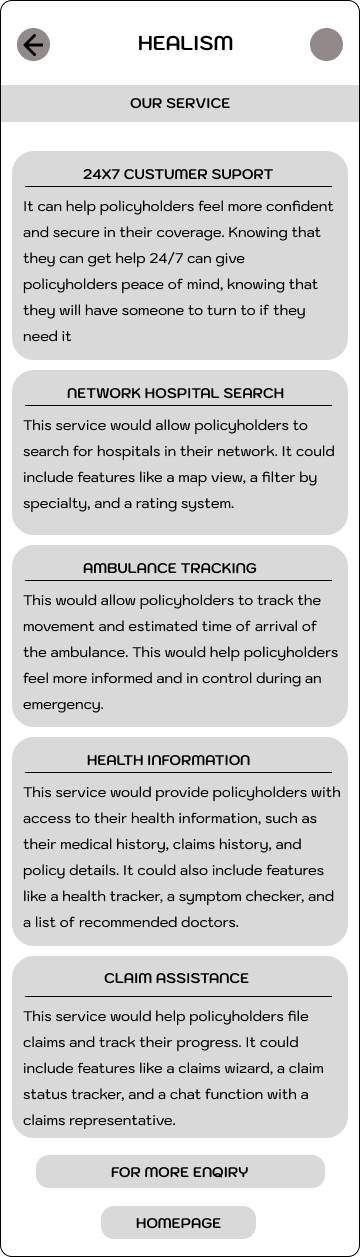
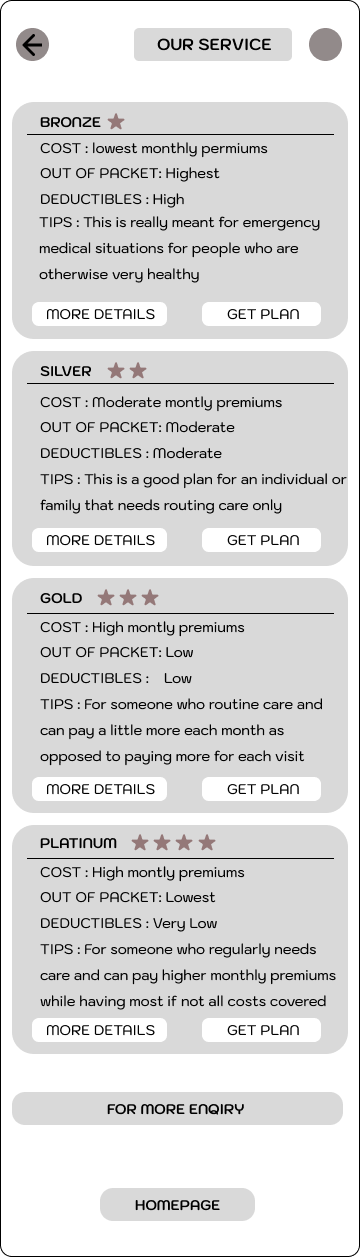
A mockup is a visual representation of a website or app's user interface (UI). It is a high-fidelity prototype that uses realistic images, text, and colors to represent the layout, functionality, and interactions of the UI. Mockups are often used in the later stages of the design process to get feedback from users and to help developers understand the design.
MOCKUPS
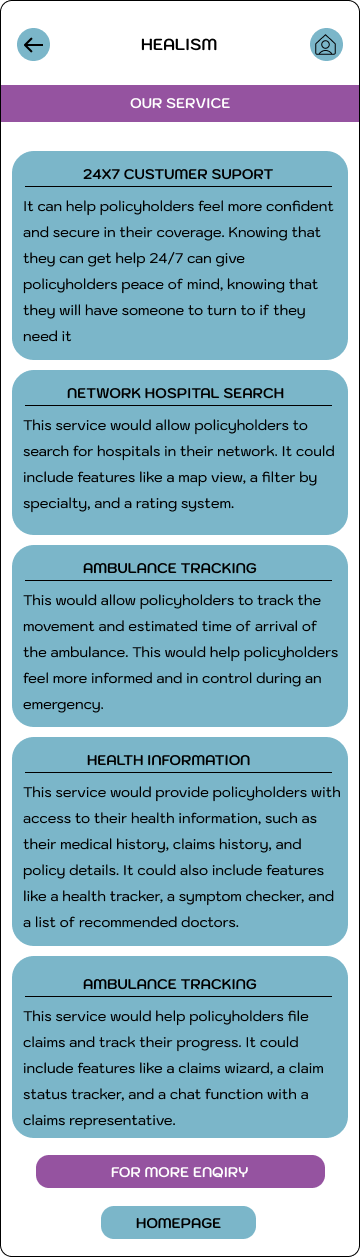
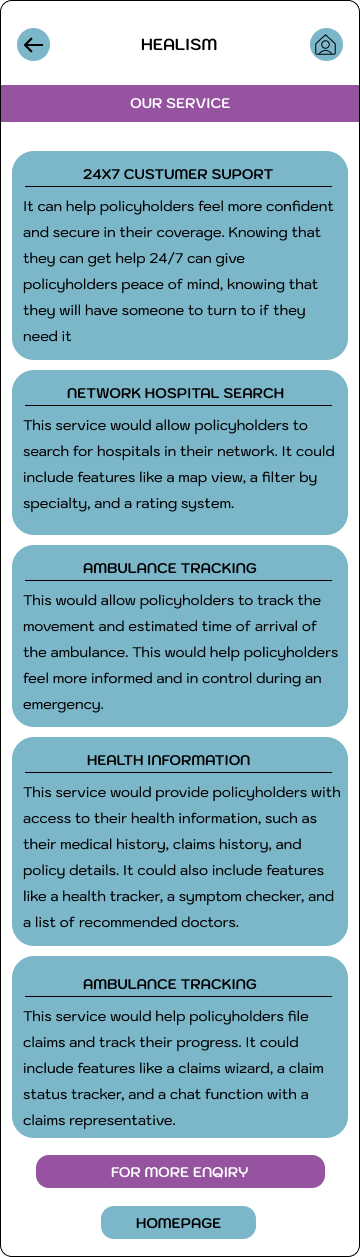

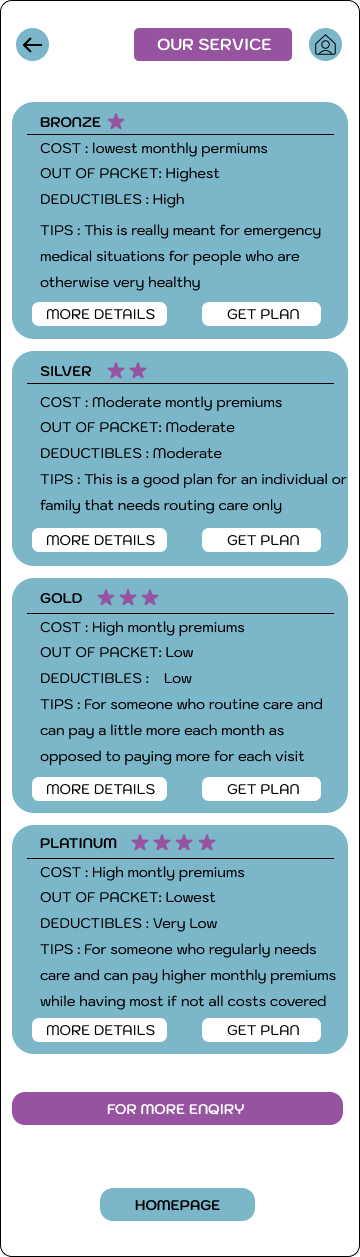


Health Insurance App Wireframe
🏠 Home – Dashboard, search, notifications.
📑 Policy – View details, renew/upgrade.
📄 Claims – Upload docs, track status.
🏥 Health Info – Find providers, coverage details.
📞 Support – Chat, call, FAQs..